


.jpg)


Typically, completion rates for customer onboarding sit, rather impressively, at the top of your analytics dashboard. But completion rates are only the prologue in a larger story about your customers. What's the rest of that customer onboarding story made of?
Customer onboarding metrics are the KPIs that show whether new customers are learning, adopting, reaching value, and getting confident enough to use your product without help. The full story has five chapters: learning, value, support, adoption, and retention. Completion rate only covers the first one. Read all five together, and you get something close to the whole story. Read completion alone, and you get a partial one that's usually quite flattering and often not meaningful.
Three of those chapters play out while onboarding is still happening, and together they produce the four core metrics this guide teaches in depth. The other two — adoption and retention — only show up later, as supporting signals you check once there's been time for behavior to prove out. This guide shows you how to read all of it together instead of one metric at a time.
What are customer onboarding metrics?
Customer onboarding metrics measure whether new customers are learning, adopting, reaching value, and getting confident enough to succeed on their own. They're narrower than general customer success metrics, which track the whole relationship. Onboarding metrics track the window that spans from start to self-sufficient — and that narrower lens makes them useful.
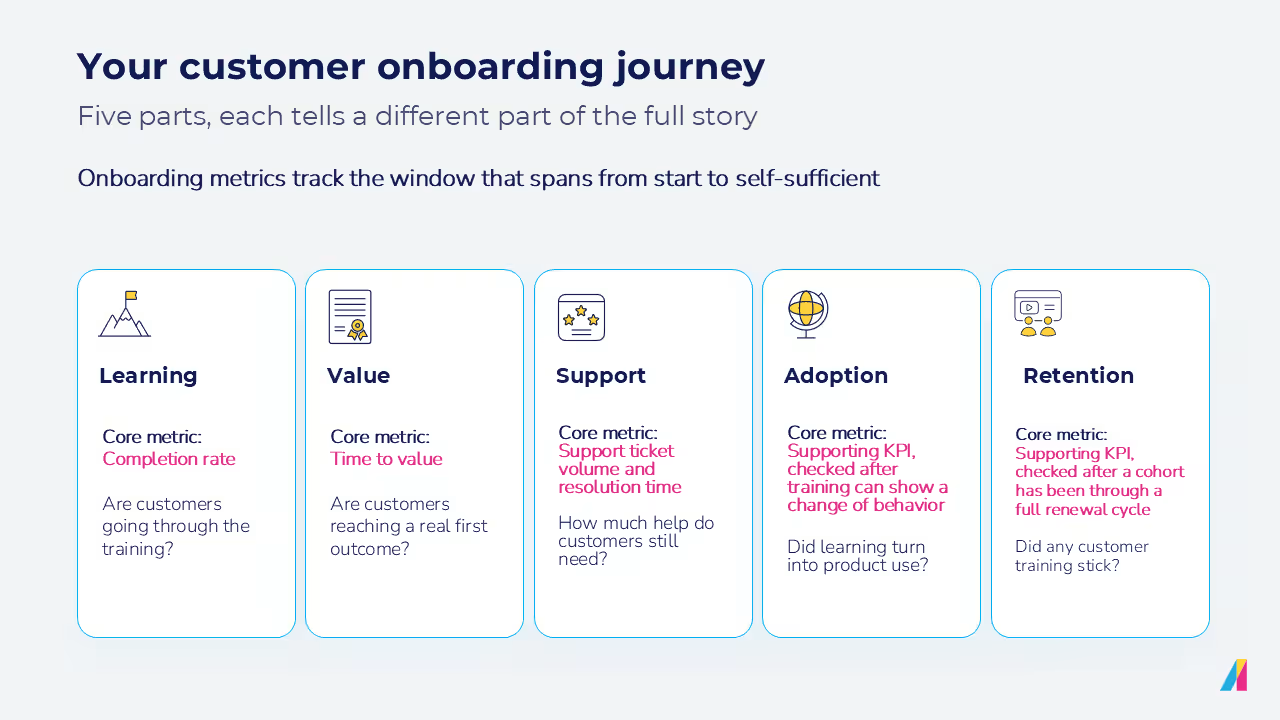
Five categories make up the customer onboarding story — but only three of them are measured while onboarding’s still happening.
Category | How it's tracked |
Learning — Are they absorbing the training? | Core metric: completion rate |
Value — Are they reaching a real first outcome? | Core metric: time-to-value |
Support — How much help do they still need? | Two core metrics: support ticket volume and support resolution time |
Adoption — Did the learning turn into product use? | Supporting KPI, checked later — once training has had time to translate into behavior |
Retention — Did any of it stick? | Supporting KPI, checked later — once a cohort has been through a full renewal cycle |
This guide goes through those four core customer onboarding metrics in depth, plus the two supporting KPIs — adoption and retention — you check them against later. (Two more supporting KPIs, activation rate and video engagement, round out the picture; more on those below.)
A metric pulled from just one category — usually completion — tells a flattering, partial story. Read the full set together, and you get a more comprehensive picture of your customer's onboarding journey from start to result.
That's also the lens worth applying if you're trying to measure the impact of customer education more broadly — onboarding metrics are the entry point into that story, not the whole of it.
Why completion rate alone doesn't prove onboarding worked
Completion tells you your training was finished, but not whether any behavior changed after that. Your customer can complete every module, pass every quiz, and still never touch the feature the training was about.
Completion is simply one of the signals
A low completion rate is worth investigating. But someone finishing a course is a completely different event from someone changing their behavior.
The data lives in different places
Completion sits in the LMS. Usage sits in product analytics. Tickets sit in the help desk. Retention sits in the CRM. Nobody has time to stitch four systems together every week, so teams default to whichever number is easiest to pull — and the narrowed view can hide trouble brewing in customer churn.
That fragmentation shows up in the data, not just in the day-to-day scramble to pull four reports together. Absorb and Lighthouse Research & Advisory's The State of Customer Education 2026 report found that 52% of programs say they're very confident they can prove ROI — but 31% admit they lack the analytics capability to back that up, 20% are working across disconnected systems, and 21% haven't even defined what success looks like in the first place. Confidence and measurement, it turns out, are two different things.
What stronger measurement looks like
Read a learning signal, a product signal, a support signal, and a retention signal together. One feels nice. Four diagnose to give you a clear path forward. That's also why product adoption with customer education has to be part of the read — completion alone never tells you that story.
Metric alone | What it says | What it can't confirm |
Completion rate | Customers finished the training | Whether they reached value or changed behavior |
Login activity | Customers showed up | Whether they did anything meaningful once inside |
Quiz score | Customers understood the material | Whether they applied it in the product |
Time in training | Customers engaged with content | Whether it was the right content |
4 core customer onboarding metrics to track
These four metrics write the first three chapters of the onboarding story — learning, value, and support — the ones you can read while a cohort is still mid-onboarding. Get good at reading these before you add anything else.
Metric (Formula) | What it tells you | What it can reveal |
Completion rate — completed ÷ started × 100 | Whether customers finish assigned content | Low completion, module drop-off, or high completion with low usage |
Time-to-value — value-milestone date − onboarding-start date | How fast customers reach their first real outcome | Slow activation, delayed ROI, early retention risk |
Support ticket volume — onboarding tickets ÷ active onboarding customers | How much help customers still need | Content gaps, unclear workflows, weak self-service |
Support resolution time — resolved time − created time | How long onboarding issues take to clear | High customer effort, poor knowledge transfer, missing content |
1. Onboarding completion rate
The percentage of customers who finish what you assigned. Good place to start, but bad place to stop.
Under 50% is a real warning sign — content that's too long, poorly timed, or hard to find. But a high number here can hide just as much because a high completion with low product usage means people are finishing training that isn't connected to anything that creates value.
To fix it: Shorten and re-sequence content around the customer's real path and put it where they're already working, so they don't have to hunt for information.
If a five-module course lives behind a separate LMS login, try breaking it into two-minute lessons embedded directly in the product's setup flow — customers finish what's already in front of them far more often than what requires a second login and a calendar reminder.
2. Time-to-value (TTV)
Time-to-value measures how long it takes a customer to reach their first meaningful outcome. Think of it as the end of the first chapter — the metric most tightly linked to retention, because the faster someone gets there, the more reason they have to keep going.
“The strongest programs are built around one early win or a small set of key milestones, not full adoption. Where teams go wrong is trying to teach everything at once instead of proving value first, then expanding from there.”
— Darren O'Connor, Director, Customer Success, Absorb
The hard part is defining the milestone honestly. Not “finished onboarding” or “logged in.” Instead, look at the first time the customer does the thing they bought your product to do.
To fix it: Move that milestone earlier and clear out whatever sits between signup and the moment it happens. If the milestone is a customer's first finished report, and reaching it currently takes three configuration screens and a data import, try pre-loading a sample dataset so customers can build that first report on day one — then help them swap in real data once they've already felt the win.
3. Support ticket volume during onboarding
Formula: onboarding-related tickets ÷ active onboarding customers. Count calls and chats too — “tickets” is shorthand for all of it.
A spike isn't automatically bad. But take a closer look if you see repetition. The same question showing up account after account is a warning light pointing at a gap in your content, not a bunch of curious customers. The stakes go beyond ticket-handling cost: Gartner's research on customer effort found that 96% of customers with a high-effort service experience become more disloyal, compared to just 9% with a low-effort one. Separately, Gartner's broader effortless-experience research has found that low-effort service experiences cut repeat contacts by up to 40% — close to exactly what a well-built onboarding library is designed to do.
To fix it: Find the top recurring topics, build the content that finally answers them, and watch that number drop. If 'how do I reset a learner's password' is showing up in a quarter of onboarding tickets, a 90-second walkthrough linked right from the password-reset error page tends to cut that ticket type down within a month — no macro or canned response required.
4. Support resolution time
Formula: resolved time minus created time. Long resolution times get blamed on the support team, but they usually point upstream — missing or poorly placed content forcing customers and agents to figure things out from scratch.
To fix it: Find which topics generate the slowest resolutions and build just-in-time content for exactly those moments.
If SSO configuration tickets take three times longer to close than the average ticket, embedding a step-by-step SSO guide directly in the admin settings page — right where the error appears — gives agents something to point to instead of walking each customer through it live.
Supporting onboarding KPIs that add context
Adoption and retention are the epilogue chapters — the ones that only get written once there's been enough time for behavior to prove out. The four core metrics above carry most of the weight. These add context — check them alongside the core four, not instead of them.
Supporting KPI | Why it’s important | When to use it |
Activation rate | Shows how many customers reached a real value action, not just finished training | Completion is high, but you're not sure anyone's really doing anything |
Feature adoption | Proves learning turned into product usage | Tying onboarding to long-term value and expansion |
Retention / churn | Confirms whether the earlier signals predicted who stayed | Reviewing cohorts across a full renewal cycle |
Video engagement | Shows where video content loses people | Video is a core part of the onboarding path |
Activation rate is time-to-value's close cousin: TTV measures how fast, activation measures how many. Amplitude's B2B technology benchmark research shows a wide gap between median and top-quartile B2B products on activation and 3-month retention — proof that the window to show value is measured in days, not weeks.
Feature adoption is downstream proof that your customer onboarding training worked. If a feature was central to onboarding and adoption stays low, the training taught the how without the why.
Retention and churn are metrics you get late in the game. You can't steer by them in the moment, but they confirm whether the earlier signals mattered. A 5-point improvement in retention can lift profits by 25–95%, depending on the business, per Bain & Company's loyalty research. That's why the leading metrics above are worth managing toward.
As for video engagement, look beyond play counts. Check completion, drop-off point, replay rate, and post-video tickets.
Tracking these metrics is one thing, but it’s important to know the next step when they disagree.
How to read onboarding metrics as retention signals
Read in isolation, each metric is a single chapter. Read together, they're the whole book — and the whole book is what predicts churn. One metric reports. Several metrics, read together, diagnose. No single metric predicts churn on its own — what predicts it is several signals agreeing, caught early enough to act.
Pattern | Likely means | Your next move |
High completion + low usage | Training's finished but disconnected from the workflow that creates value | Check whether content maps to the highest-value actions |
Low completion + high tickets | Customers are skipping content that's too long or hard to find | Shorten it, add role-based paths and reminders |
High video drop-off, same spot | The video is too long or confusing at one specific step | Split it up, add an example, tie it to one action |
Long TTV + high churn risk | Customers aren't reaching value fast enough to build confidence | Define an earlier milestone and design toward it |
High resolution time post-completion | Customers finished training but couldn't apply it later | Add troubleshooting content and just-in-time guidance |
Support volume drops after content update | The new content is working | Document it, prioritize the next fix the same way |
The gap between programs that read the signals this way and programs that don't show up in the numbers. The State of Customer Education 2026 report found that high-return programs act on what they measure: 38% use their data to improve content and 31% use it to trigger proactive outreach. Low-return programs mostly stop at the reporting step — only 14% update content and just 5% trigger outreach based on what the data shows.
Those downstream connections are where onboarding metrics start to matter for customer education and revenue retention — not just for the onboarding window itself.
How an LMS and AI-powered performance enablement help teams act on the data
Knowing what to measure isn't enough to change anything. If you can see it — and track and act on it every week, across every cohort — you can improve it, without drowning in spreadsheets.
An LMS gives teams a system of record
Your LMS should organize training into courses and paths, run assessments, and report on completion, cohort performance, and certifications in one current place that can be queried.
AI-powered performance enablement brings help into the flow of work
Instead of waiting for a customer to open a full course or file a ticket, specialized AI agents can answer questions, offer refreshers, and recommend the next move right where people already are. Absorb builds this kind of support directly into the LMS as an AI intelligence layer that sits on top of onboarding content and usage data. Aura, Absorb's approach to AI-powered performance enablement, closes the gap between learned it once and needs it now — without replacing the CSMs, support teams, or courses still doing the heavy lifting.
Natural-language questions replace the custom report
A manager can ask which customers are behind, where a cohort dropped off, or how completion connects to support demand — and get an answer instead of building a dashboard from scratch.
Capability | Role in onboarding measurement | Example |
Structured onboarding paths | Organizes training by role, segment, or milestone | Customers follow the right path instead of a generic one |
Progress and completion reporting | Shows who started, paused, or dropped off | CS teams flag accounts needing outreach |
Content engagement data | Shows where customers stop, repeat, or skip | Content teams find the confusing section |
Support + learning signal connection | Compares training activity against ticket volume | Teams find where education cuts support demand |
Aura AI agents | Answers and recommendations inside existing workflows | Customers get help when they need it, not after a full course |
Natural-language data questions | Lets admins query learner progress directly | No custom report required |
A spreadsheet can tell you what percentage of customers completed onboarding. A connected system can tell you which customers are behind, where they dropped off, and which signals connect to adoption — early enough to do something about it. Explore how Absorb connects onboarding learning data to outcomes with an AI-powered LMS and Aura.
Completion is the prologue, not the whole story
The strongest onboarding metrics confirm much more than whether training got finished. They show whether customers reached value, needed less support, adopted the product, and built the confidence to stay. Completion is where measurement starts. Time-to-value, support demand, and adoption are where it starts connecting to customer expansion and revenue retention downstream.
FAQs
What are customer onboarding metrics?
Customer onboarding metrics are the KPIs that measure whether new customers are learning, adopting, reaching value, and becoming confident enough to use a product on their own. They span learning, value, support, adoption, and retention across the window between signup and self-sufficiency, rather than the broader, ongoing view a general customer success metric would track.
What are the most important customer onboarding metrics?
Four carry most of the weight: completion rate, time-to-value, support ticket volume, and support resolution time. Activation and product adoption act as supporting signals that confirm learning turned into usage. Track the four core metrics first, then use activation and adoption to confirm the story they're telling held up once customers were on their own.
How do you measure customer onboarding success?
By combining several signals rather than trusting one: learning progress, time-to-value, support demand, product adoption, and retention outcomes together. A customer who completes training but never adopts the product hasn't finished, or even really started, their journey. The goal isn't a single onboarding score, but a pattern across signals that either agree or contradict each other.
What is a good onboarding completion rate?
There's no universal benchmark worth trusting. It depends on product complexity, customer segment, and whether training is required or optional. The best benchmark is your own segment baseline, tracked over time. Compare each new cohort to your own historical average for that segment rather than to an industry number that may not reflect your product's complexity.
How do you measure onboarding video success?
Look past view counts: completion rate, drop-off point, replay rate, click-through to the next step, and tickets raised right after viewing. A consistent drop at the same moment flags a confusing section. Together, these show whether a video is teaching something or just getting watched, which matters more than raw view counts ever will.
How does an LMS help track customer onboarding metrics?
It centralizes learning paths, course completion, assessments, progress reporting, cohort analysis, and video engagement, and connects that data to support and usage signals, so completion numbers stop living in a separate system from the outcomes they're supposed to predict. The result is one current view instead of four disconnected reports pulled together by hand.
How can AI improve customer onboarding measurement?
AI-powered performance enablement, like Absorb's Aura intelligence layer, can answer routine onboarding questions inside the product, flag cohorts that are falling behind before a person notices, and let admins ask plain-language questions — “which customers haven't reached their first outcome yet?” — instead of building a new report from scratch. It doesn't replace the four core metrics; it makes them faster to check every week and easier to act on the moment something drifts, which is usually where onboarding measurement breaks down in practice. Explore how Absorb connects onboarding learning data to customer outcomes with Aura and an AI-powered LMS.


_cardimg.avif)
.avif)